Skip to content

Lunar Motion Posts

New Release: Hail the Day That Sees Him Rise for SATB Choir, Piano, and Organ

We are pleased to announce the release of our newest choral arrangement, Hail the Day That Sees Him Rise.

This joyful SATB arrangement celebrates the Resurrection and Ascension of Jesus Christ and is designed with the needs of the church choir in mind. The arrangement is written at an easy/simple difficulty level, making it accessible to a wide range of choirs while still providing a full and festive musical presentation. Optional hand chime and finger cymbal parts offer additional opportunities to enhance the celebration.

A Hymn for Easter and Ascension

While Hail the Day That Sees Him Rise is often sung on or near Easter in celebration of Christ’s Resurrection, the hymn originally commemorated Ascension Day, which takes place 40 days after Easter. Its text beautifully connects the joy of the empty tomb with the triumphant Ascension of the Savior.

This arrangement was originally performed by a church choir in Kaysville, Utah, for Easter 2025. The goal was to create an arrangement that would be both musically satisfying and practical for a church choir to prepare without an extensive rehearsal commitment.

Whether you are looking for music for Easter Sunday, Ascension Sunday, or another worship service celebrating the Savior, we hope this arrangement will be a useful addition to your choir’s repertoire.

Get the Arrangement

The arrangement is now available through Sheet Music Direct:

Purchase “Hail the Day That Sees Him Rise”

We hope you and your choir enjoy singing it as much as we enjoyed performing it!

World Cup Model Accuracy – Final

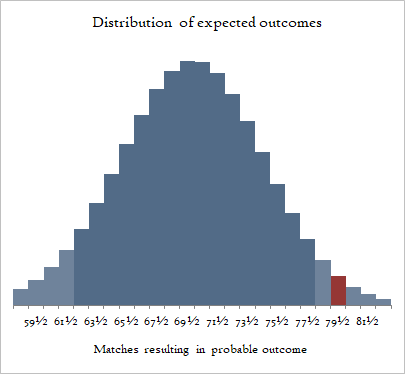
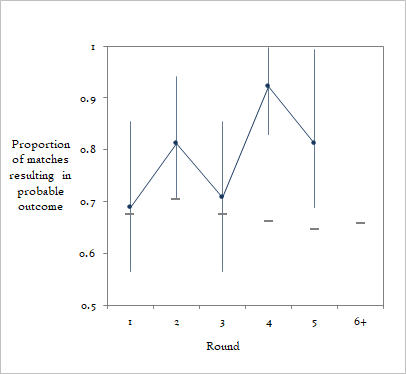
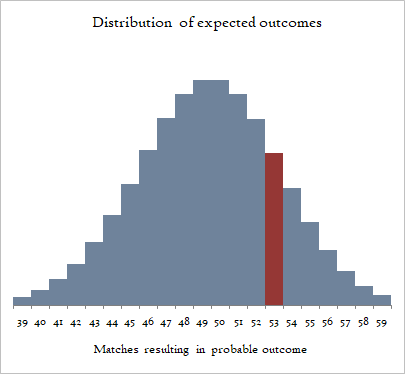
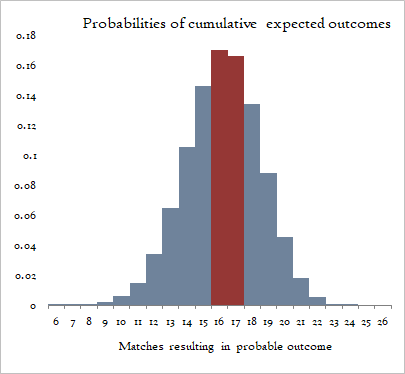
The World Cup 2026 is over. Below is the basic analysis of model accuracy through the end of the tournament. The blue bars represent the distribution of expected results, the red bar represents the actual model performance and the darker blue bars represent roughly the middle 90 percent of expected results.

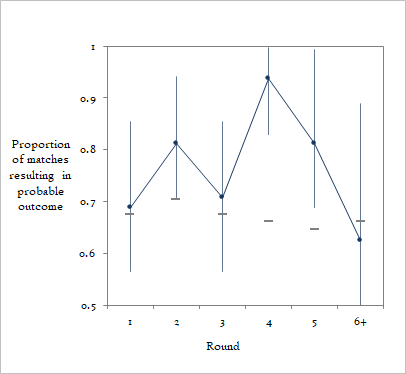
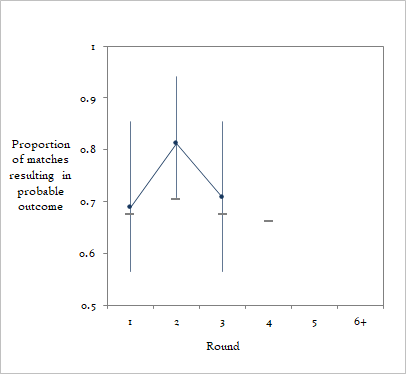
The model consistently over-predicted the match results up until the semifinals. The cumulative over-prediction was statistically significant with the 90-percent confidence interval between 62.3 and 77.8. This means that through the tournament, the FIFA rankings and my adjustments underestimated the chances the favored team had of winning the match. This effect was driven largely by the second round of the group stage, and the knockout rounds through the Quarterfinals. Indeed, the three rounds of knockout play only saw three upsets (Paraguay and Switzerland on penalty kicks and Norway in regular play) where we would have expected about 10 or 11 upsets. There were no upsets in the Quarterfinals. However, the Semifinals, the Third Place match, and the Final saw three upsets out of four matches. See the chart below where the blue line and dots with error bars represent the actual performance with 90% confidence intervals and the gray dash represents the expected model performance.

Throughout the tournament we saw an effect where when the game mattered more, the favored team performed better than the model. This held true until the final four matches where we saw three upsets. In summary, the data suggests that the FIFA rankings are good predictors for the outcome probabilities of matches for friendlies, qualifying matches, and group stage matches where a loss or tie is not a tournament-breaker.

World Cup Model Accuracy and Semifinal Probabilities

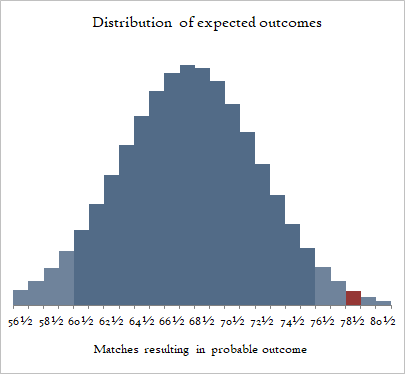
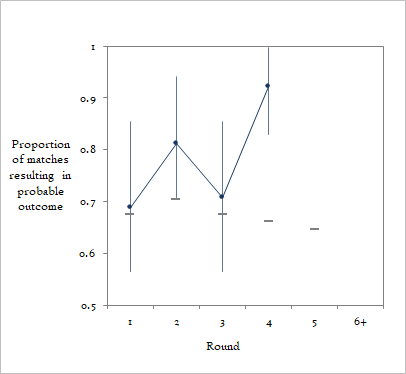
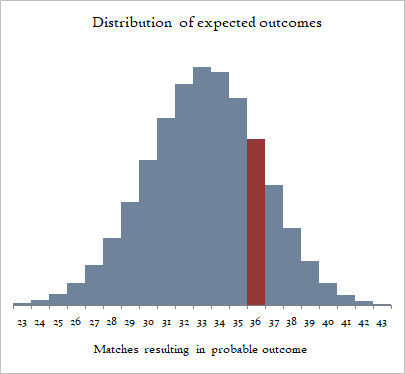
Below is the basic analysis of model accuracy through the end of the Quarterfinals. The blue bars represent the distribution of expected results, the red bar represents the actual model performance and the darker blue bars represent roughly the middle 90 percent of expected results.

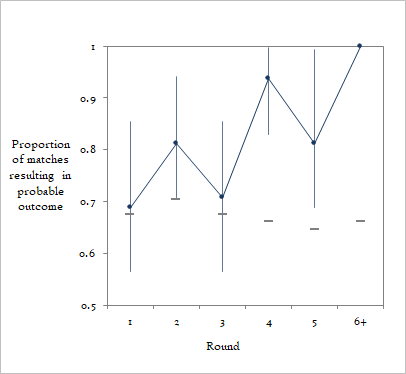
The model continues to over-predict the match results. The cumulative over-prediction is statistically significant with the 90-percent confidence interval between 60.3 and 75.5. This means that through the Quarterfinals, the FIFA rankings and my adjustments underestimate the chances the favored team has of winning the match. This effect is driven largely by the second round of the group stage, and all of the knockout rounds. Indeed, the three rounds of knockout play only saw three upsets (Paraguay and Switzerland on penalty kicks and Norway in regular play) where we would have expected about 10 or 11 upsets. There were no upsets in the Quarterfinals. See the chart below where the blue line and dots with error bars represent the actual performance with 90% confidence intervals and the gray dash represents the expected model performance.

Here are the Semifinal probabilities based on rankings updated from the Quarterfinal results. Scores will be updated periodically throughout the round.

TeamFTETPK
52%France0
48%Spain2
43%England1
57%Argentina2

World Cup Model Accuracy and Quarterfinal Probabilities

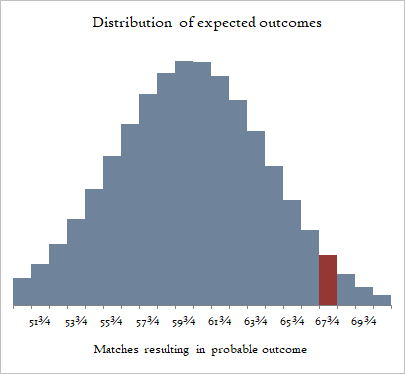
Below is the basic analysis of model accuracy through the end of the Round of 16. The blue bars represent the distribution of expected results and the red bar represents the actual model performance.

The model continues to over-predict the match results. The cumulative over-prediction is statistically significant with the 90-percent confidence interval between 58 and 73. This means that through the Round of 16, the FIFA rankings and my adjustments underestimate the chances the favored team has of winning the match. This effect is driven largely by the second round of the group stage, the Round of 32 and the Round of 16. Indeed, the two rounds of knockout play only saw three upsets (Paraguay and Switzerland on penalty kicks and Norway in regular play) where we would have expected about eight upsets. See the chart below where the blue line and dots with error bars represent the actual performance with 90% confidence intervals and the gray dash represents the expected model performance.

Here are the Quarterfinal probabilities based on rankings updated from the Round of 16 results. Scores will be updated periodically throughout the round.

TeamFTETPK
61%France2
39%Morocco0
62%Spain2
38%Belgium1
30%Norway1
70%England2
70%Argentina12
30%Switzerland10

World Cup Model Accuracy and Round of 16 Probabilities

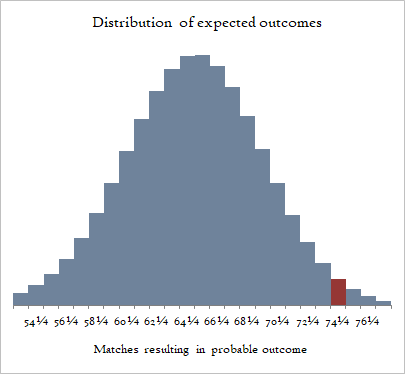
Below is the basic analysis of model accuracy through the end of the Round of 32. The blue bars represent the distribution of expected results and the red bar represents the actual model performance.

The model continues to over-predict the match results. The cumulative over-prediction is statistically significant with the 90-percent confidence interval between 53 and 67. This means that through the Round of 32, the FIFA rankings and my adjustments underestimate the chances a team has of winning the match. This effect is driven largely by the second round of the group stage and the Round of 32. Indeed, the Group of 32 only saw one upset (Germany on penalty kicks) where we would have expected five or six upsets. See the chart below where the blue line and dots with error bars represent the actual performance with 90% confidence intervals and the gray dash represents the expected model performance.

Here are the Round of 16 probabilities based on rankings updated from the Round of 32 results. Scores will be updated periodically throughout the round.

TeamFTETPK
20%Paraguay0
80%France1
32%Canada0
68%Morocco3
41%Portugal0
59%Spain1
47%United States1
53%Belgium4
68%Brazil1
32%Norway2
44%Mexico2
56%England3
77%Argentina3
23%Egypt2
45%Switzerland004
55%Colombia003

World Cup Model Accuracy and Round of 32 Probabilities

Below is the basic analysis of model accuracy through the end of the group stage. The blue bars represent the distribution of expected results and the red bar represents the actual model performance.

The model continues to slightly over-predict the match results, though the cumulative over-prediction is not statistically significant. This means that through the third round and the completion of the group stage, the FIFA rankings and my adjustments are good indicators of the chances a team has of winning the match. It is interesting to note that the second round over-prediction by itself was a statistical anomaly with the expected model performance falling below the lower 90% confidence interval of the actual performance. See the chart below where the blue line and dots with error bars represent the actual performance with 90% confidence intervals and the gray dash represents the expected model performance.

Here are the round of 32 probabilities based on rankings updated from the third round results. Scores will be updated periodically throughout the round.

TeamFTETPK
67%Germany103
33%Paraguay104
82%France3
18%Sweden0
38%South Africa0
62%Canada1
49%Netherlands102
51%Morocco103
55%Portugal2
45%Croatia1
74%Spain3
26%Austria0
76%United States2
24%Bosnia and Herzegovina0
57%Belgium3
43%Senegal2
62%Brazil2
38%Japan1
48%Ivory Coast1
52%Norway2
65%Mexico2
35%Ecuador0
78%England2
22%DR Congo1
88%Argentina12
12%Cape Verde11
49%Australia102
51%Egypt104
59%Switzerland2
41%Algeria0
79%Colombia1
21%Ghana0

New Release: Abide With Me! for SATB Choir, Piano, Violin, and Cello

Lunar Motion Music is pleased to announce the release of a new arrangement of the beloved hymn “Abide With Me!”

Scored for SATB choir with piano, violin, and cello, this arrangement presents the familiar melody in a warm and expressive setting while remaining accessible to church choirs of varying experience levels. The original piano accompaniment is complemented by lyrical violin and cello parts that add richness and depth without overshadowing the choir.

Designed with an easy difficulty level, this arrangement is ideal for ensembles seeking a meaningful anthem that can be prepared with limited rehearsal time. It is well suited for regular worship services as well as memorial services, funerals, All Saints observances, and other occasions centered on faith, comfort, and hope.

Available now through Sheet Music Direct:

https://www.sheetmusicdirect.com/se/ID_No/2043365/Product.aspx

We hope this arrangement will be a meaningful addition to your choir’s repertoire.

World Cup Model Accuracy and Third Round Probabilities

With the conclusion of the second round, below is the basic analysis of model accuracy. The blue bars represent the distribution of expected results and the red bar represents the actual model performance.

The model now seems to slightly over-predict the match results, though the over-prediction is not statistically significant. This means that through the second round, the FIFA rankings and my adjustments are good indicators of the chances a team has of winning the match.

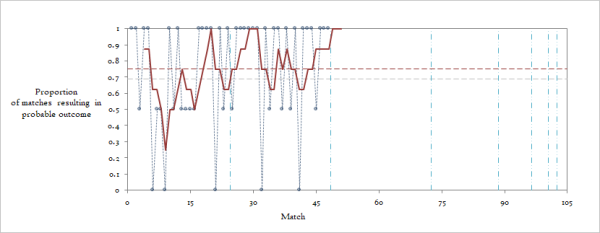
It is interesting to note that favored teams did perform slightly better in the second round as seen in this trend chart. The dots represent the match result; 0 means the favored team lost, 0.5 means the match was a tie, and 1 means the favored team won. The heavy red line is the four-game moving average. The light gray dashed line is the expected model mean. The red dashed line is the actual model mean. The vertical lines separate the different tournament stages.

From this, we can see the favored team performance improving in the second round. Perhaps this is to be expected.

With that, here are the third round probabilities based on rankings updated from the second round results. Scores will be updated periodically throughout the round.

HomeAway
25%Scotland03Brazil75%
87%Morocco42Haiti13%
54%Switzerland21Canada46%
45%Bosnia and Herzegovina31Qatar55%
26%Czechia03Mexico74%
34%South Africa10Korea66%
27%Curaçao02Côte d’Ivoire73%
33%Ecuador21Germany67%
65%Japan11Sweden35%
23%Tunisia13Netherlands77%
32%Türkiye32USA68%
46%Paraguay00Australia54%
24%Norway14France76%
70%Senegal50Iraq30%
48%Egypt11IR Iran52%
15%New Zealand15Belgium85%
47%Cabo Verde00Saudi Arabia53%
32%Uruguay01Spain68%
22%Panama02England78%
76%Croatia21Ghana24%
48%Algeria33Austria52%
10%Jordan13Argentina90%
47%Colombia00Portugal53%
54%Congo DR31Uzbekistan46%

World Cup Model Accuracy and Second Round Probabilities

My model for World Cup match win probabilities is based on the FIFA rankings which are based on an Elo ranking system. I made adjustments to each team’s ranking score based on the geography. It is well established that teams from the continent of play perform better than those who have to travel farther. I do give consideration to where team players are based for club play. Below is the basic analysis of model accuracy. The blue bars represent the distribution of expected results and the red bars represent the actual model performance.

The model is right on target. This means that the FIFA rankings and my adjustments are good indicators of the chances a team has of winning the match.

With that, here are the second round probabilities based on rankings updated from the first round results. Scores will be updated periodically throughout the round.

HomeAway
56%Czechia11South Africa44%
72%Switzerland41Bosnia and Herzegovina28%
63%Canada60Qatar37%
61%Mexico10Korea39%
86%Brazil30Haiti14%
28%Scotland01Morocco72%
62%USA20Australia38%
57%Türkiye01Paraguay43%
65%Germany21Côte d’Ivoire35%
76%Ecuador00Curaçao24%
69%Netherlands51Sweden31%
31%Tunisia04Japan69%
75%Uruguay22Cabo Verde25%
83%Spain40Saudi Arabia17%
62%Belgium00IR Iran38%
25%New Zealand03Egypt75%
41%Norway32Senegal59%
86%France30Iraq14%
76%Argentina20Austria24%
33%Jordan12Algeria67%
85%England00Ghana15%
34%Panama01Croatia66%
77%Portugal50Uzbekistan23%
71%Colombia10Congo DR29%

World Cup First Round Probabilities

The World Cup started today. Here are my probabilities of all the first round matches. Scores updated at the end of the first round.

HomeAway
75%Mexico20South Africa25%
59%Korea21Czechia41%
69%Canada11Bosnia and Herzegovina31%
68%USA41Paraguay32%
31%Qatar11Switzerland69%
52%Brazil11Morocco48%
33%Haiti01Scotland67%
47%Australia20Türkiye53%
84%Germany71Curaçao16%
59%Netherlands22Japan41%
44%Côte d’Ivoire10Ecuador56%
52%Sweden51Tunisia48%
87%Spain00Cabo Verde13%
66%Belgium11Egypt34%
27%Saudi Arabia11Uruguay73%
79%IR Iran22New Zealand21%
67%France31Senegal33%
40%Iraq14Norway60%
78%Argentina30Algeria22%
69%Austria31Jordan31%
75%Portugal11Congo DR25%
61%England42Croatia39%
32%Ghana10Panama68%
27%Uzbekistan13Colombia73%